Hypothesis Testing on a Continental Scale: GPU-based Time Series Classification - Follow-On
The large scale hypothesis testing was first realized in 2023-2024 and presented at the Netherlands Center for Geodesy and Geo-Informatics (NCG Symposium 2024) at the Delft University of Technology. More information about this earlier work can be found here. The feedback from the symposium along with our own findings showed that there were a number of improvements possible. The updated work was subsequently presented at the Living Planet Symposium 2025 in Vienna, Austria. In both occassions, the work and its credits are shared with Adriaan van Natijne (see his website).
This time we downloaded the latest EGMS L2b (calibrated; 2019-2023) dataset (again) which contains about 15 billion deformation timeseries spread out over Europe. We imposed over 5000 models on each timeseries to 1) find the best model and 2) extract meaningful model parameters such as velocity, acceleration, seasonality and, most importantly, breakpoints. This contrasts the EGMS display and analysis, which assumes one and the same model for all of Europeans deformation timeseries. This update includes about 50% more timeseries and about 50% more models compared to the approach from 2024. To figure out the best model, we used the Bayesian Information Criterion (BIC), instead of the Overall Model Test (OMT). The benefit of the BIC over the OMT is twofold, 1) the BIC does not require an estimate of the variance of the residuals, which varies for obvious reasons and 2) the BIC is faster than the OMT (the OMT uses a gamma-function). Additionally, an inaccurate variance input may lead to OMT test results with a zero probability or one probability for all models, obscuring the probability difference between the proposed models. The BIC does not require any a-priori information and is therefore not sensitive to that. The BIC also tends to better balance the model fit versus the number of model parameters. This balance has, however, only been investigated emperically, by comparing model preferences from OMT, AIC and BIC.
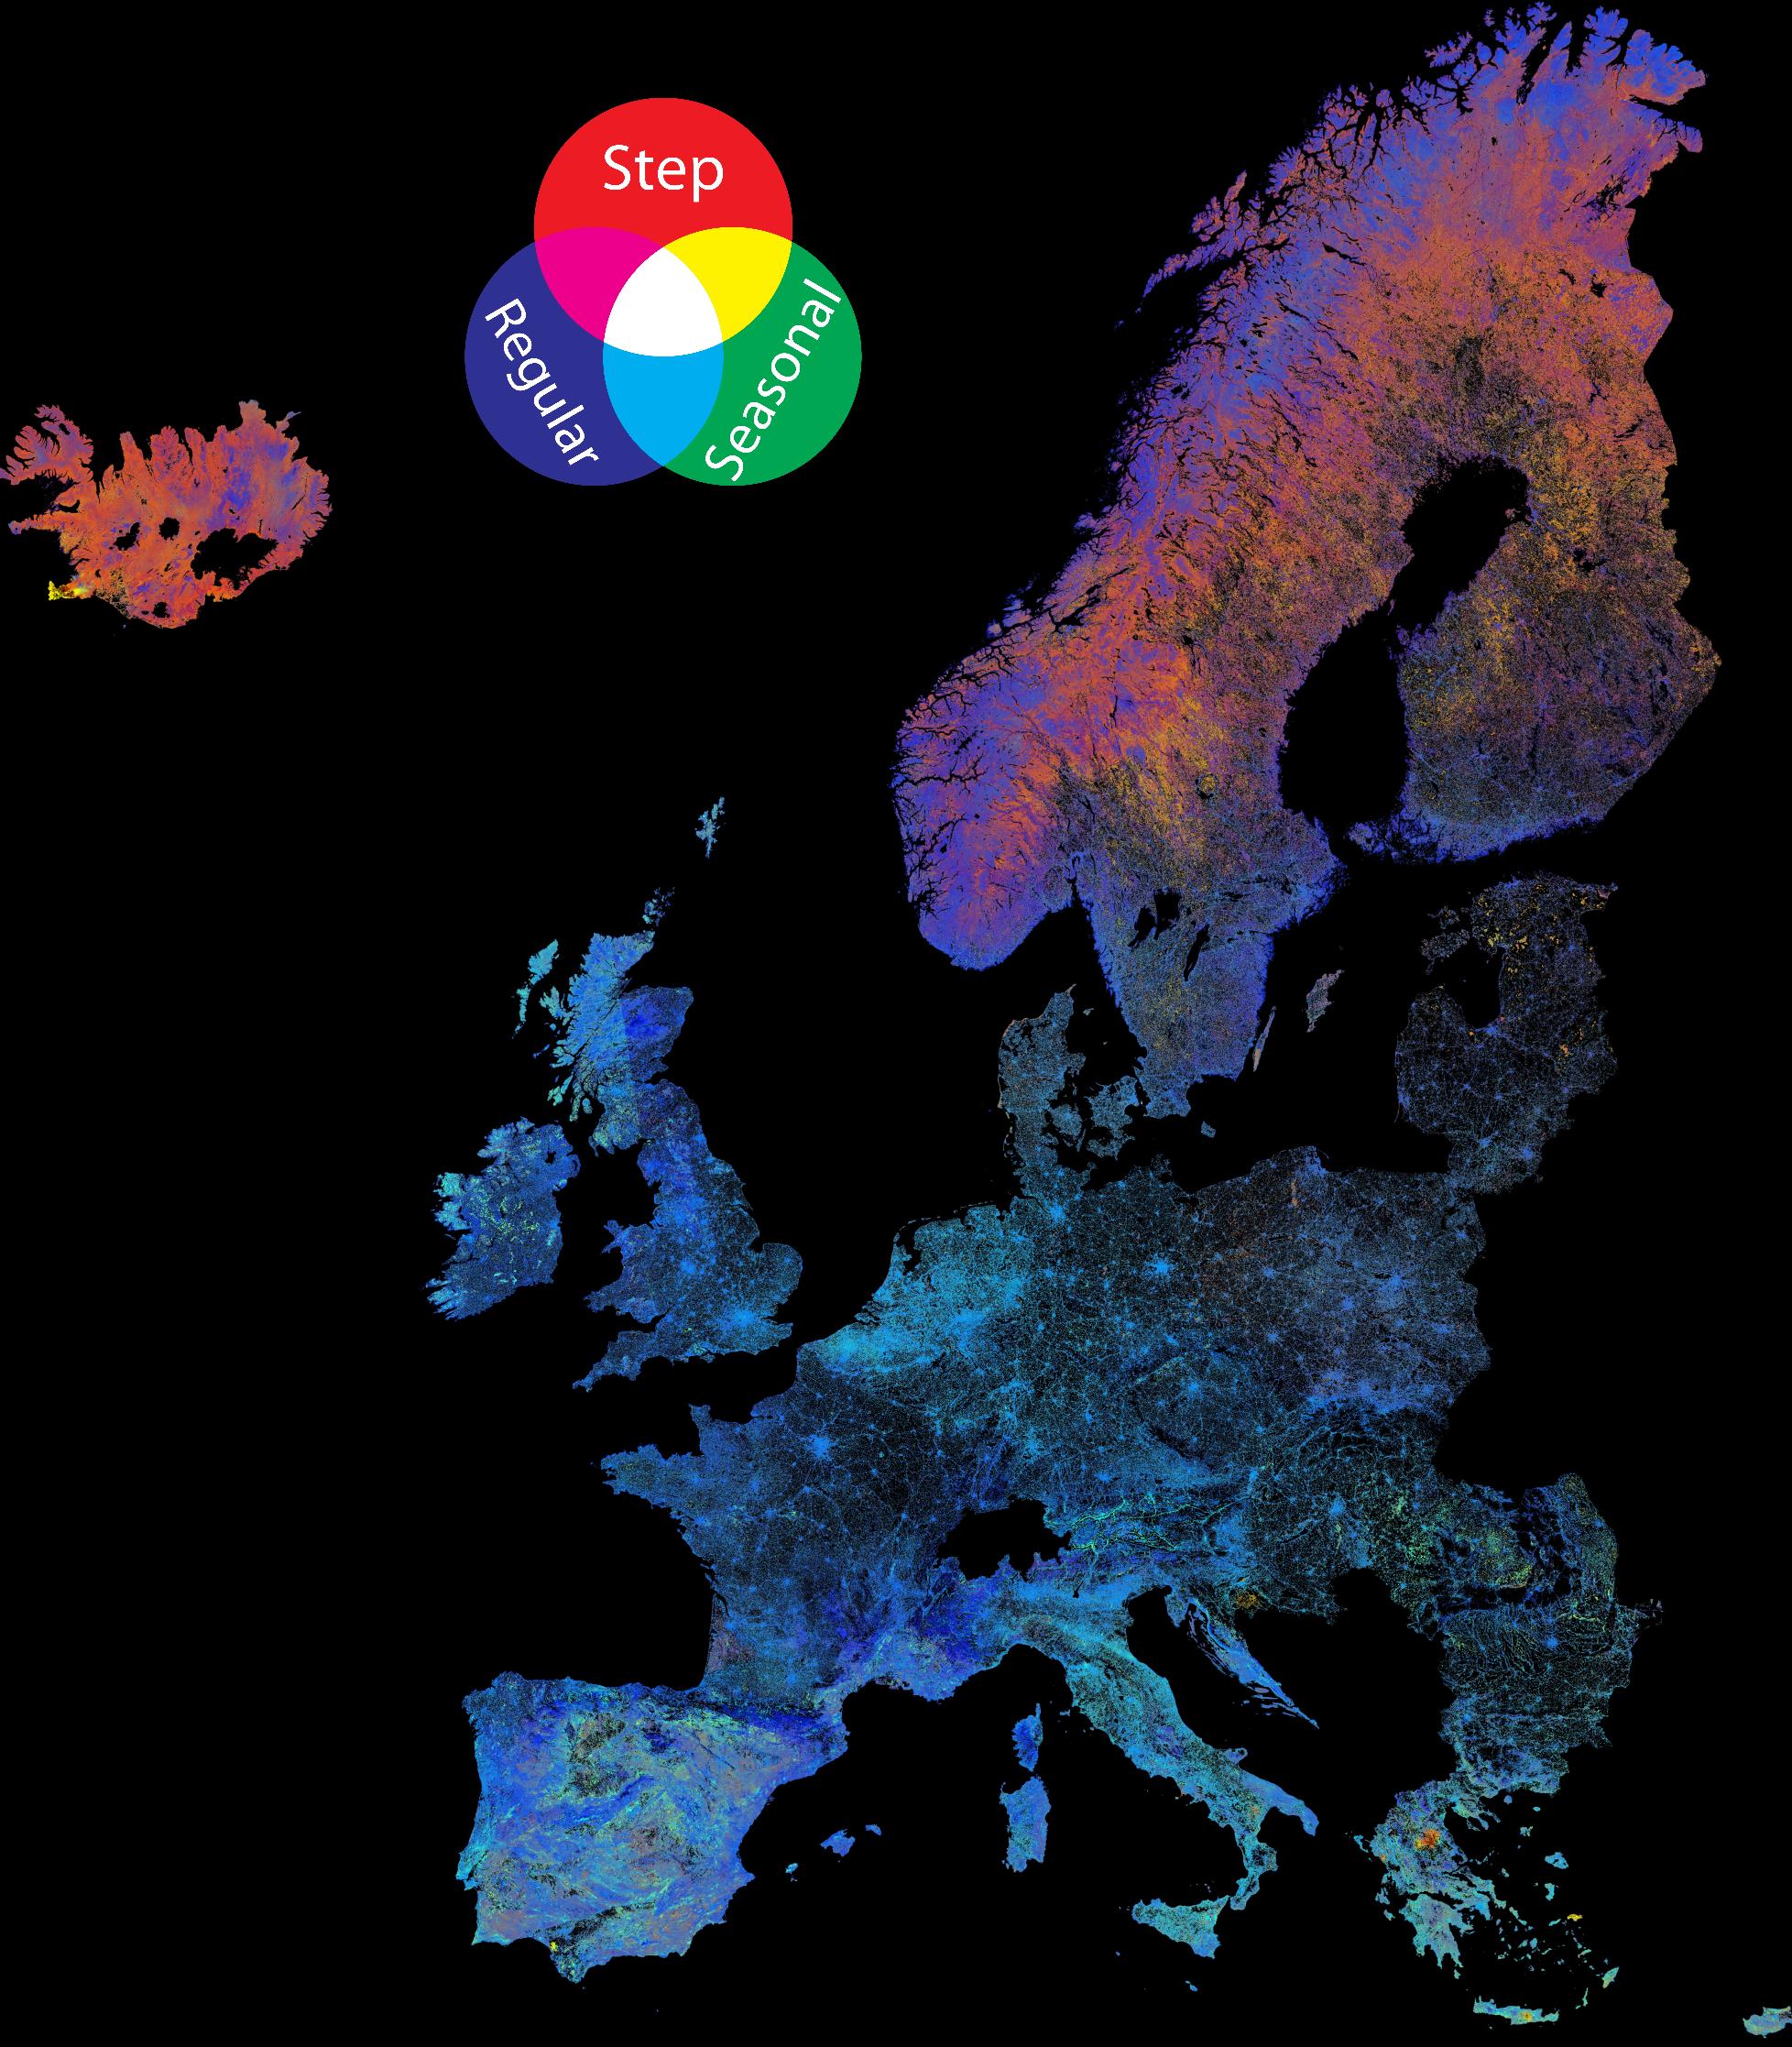
With each measurement location having a new, tailored model, it becomes possible to distinguish the time series and ultimately the underlying deformation dynamics by the type of model that was selected. In the European map on the right, the blue color indicates that the majority of the time series are best modelled with polynomials. In the same fashion, green indicates seasonal behaviour and red demonstrates discontinuous behaviour. Color combinations are possible, because each grid cell in the example on the right is aggregated from all models in that cell.
This map and the underlying individual time series are freely accessible and available in our novel web viewer. Each time series is clickable, displaying the original data and the best model fit. Aggregated results of all model fits show that the RMSE is comparable between the EGMS model fit and our tailored model fit (both ~4 mm). Thus a more realistic model is applied at no cost to the quality of the model fit.
Our method helps to analyse the local heterogeneity in deformation processes, and provides a starting point for large scale analysis of the EGMS data. However, to link deformation anomalies to natural behavior it is necessary to interpret the deformation signal. Especially with more complex models, multiple signals are superimposed that may counteract each other and complicate the translation to geomorphological or mechanical (building) processes. To avoid this, the model could be rerun using only models with a clear physical interpretation. The requirement of the BIC that the true model is among the tested models, and that they will hold under the assumption that the deformation behavior is rooted in a geomorphological/mechanical process
Our results show that in 94% of the cases the standard EGMS model fit can be improved with another model. This improves both the quantification of the deformation as well as the classification of the deformation type. Our results support a wide range of end users in the stability assessment at various scales and are more accessible and easy to interpret even with limited knowledge of the InSAR methodology. This has been visualized on egms-new.fwrite.org.
This work was presented at the Living Planet Symposium 2025.
The work was partially inspired by Kulshrestha, A., Chang, L., & Stein, A. (2022). Use of LSTM for sinkhole-related anomaly detection and classification of InSAR deformation time series. IEEE Journal of selected topics in applied earth observations and remote sensing, 15, 4559-4570. doi:10.1109/JSTARS.2022.3180994
Poster of the work presented at the Living Planet Symposium 2025 in Vienna, Austria.